WATER AND HYDROLOGY RESOURCES
ON THE INTERNET
Reservoir conditions, precipitation indexes, snow charts, drought maps and more …
RESERVOIR CONDITIONS
Reservoir Conditions
 Go here for an interactive map of the major reservoirs in the state. Click on a reservoir name to see storage graphs for individual reservoirs. (Click here for non-interactive version.)
Reservoir Conditions – Top of Conservation Conditions (Statewide)
This variation of the standard DWR reservoir webpage shows the amount of storage available for flood control.
Reservoirs – Interactive
 This page allows you to select individual reservoirs and view graphs of current versus historical and average conditions. This page has information on more reservoirs than the graphs listed above.
For even more on reservoir conditions …
- Click here for the California Data Exchange Center (CDEC) webpage for reservoirs.
- For more information on Central Valley reservoirs and operations, click here.
PRECIPITATION
Northern Sierra Precipitation: Eight Station Index
Click on the image to view a graph of the Northern Sierra 8-station index.
San Joaquin Precipitation: Five Station Index
Check out a graph of the San Joaquin 5-station index here.
 Tulare Basin Precipitation: Six Station Index
Check out the newest index, the Tulare Basin Six Station index here.
 Rainfall Maps
You can see a rainfall map for the last hour, six hours, 24 hours, or more at this webpage. Look at it statewide or by region.
For even more on precipitation …
SNOW DATA
 Snow Water Content graph
View a snow water content graph for the water year for each of the three zones in the Sierras.
Snow Water Content map
Get a simple map of current snow water content levels of the three zones in the Sierras here.
 Sierra Nevada snow maps
You can find just about anything else you want to know about the snowpack – like temperature, snowmelt, sublimation and more – at the National Weather Service’s Snow Analysis page.
For even more on snow conditions:
CURRENT WEATHER
 Radar
Radar
Check out the radar from the National Weather Service.

 National Doppler Radar Sites
Access Doppler radars from locations throughout California and the West.
 Satellite
Multiple satellite views for the West Coast.
 California-Nevada River Forecast Center
River, snow, precipitation, temperature, freezing levels, water temperature and more is available at the National Weather Service’s California-Nevada River Forecast Center.
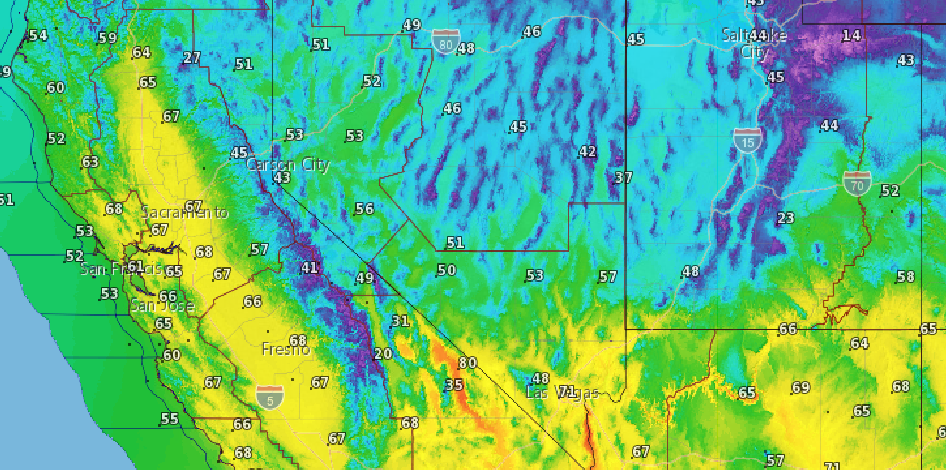
 National Weather Service graphical forecasts for the Western US
View maximum temperature, minimum temperature, dew point, wind speeds, precipitation and more.
For more on weather conditions …
- Click here for the California Data Exchange Center (CDEC) webpage for weather conditions.
- Click here for the National Weather Service, Sacramento web page.
CLIMATE AND DROUGHT
 California Climate Data Archive
Get long term precipitation and temperature data and more at this climate montioring and data access website sponsored by the California Energy Commission, the Scripps Institute of Oceanography and the Western Regional Climate Center.
 West Wide Drought Tracker
View precipitation data for Western states.
 Drought Monitor
The U. S. Drought Monitor is published every Thursday. Click on the image to view the latest map.
 Quick Drought Response Index (QuickDRI)
The Quick Drought Response Index (QuickDRI) is a shorter-term indicator of dryness. QuickDRI is designed to provide a snapshot of anomalously dry or wet conditions over the past 4 weeks and serves as an indicator of emerging or rapidly changing drought conditions.
 Groundwater and Soil Moisture Conditions from GRACE-FO
Groundwater and soil moisture drought indicators are generated weekly based on terrestrial water storage observations derived from GRACE-FO satellite data and integrated with other observations, using a sophisticated numerical model of land surface water and energy processes.
 Vegetation Drought Response Index (Vegi-DRI)
Produced every two weeks, the maps provide regional to sub-county scale information about drought’s effects on vegetation, integrating satellite-based observations of vegetation conditions, climate data, and other biophysical information such as land cover/land use type, soil characteristics, and ecological setting.
FORECASTS
 National Weather Service: 30-day forecasts
30-day forecast for temperature and precipitation.
 Water supply forecast charts
Tool from the Natural Resources Conservation Service to forecast water supply by river basin.
 Wildfire Risk Maps
See the wildfire outlook for the current month, the month following and a seasonal look at the two months beyond that.
This page updated 4/2/2020.


