Written by Robert Shibatani
The 2020-21 Water Year is officially over… and not a moment too soon. It’s a year that many of us would like to put behind us and not just because of water.
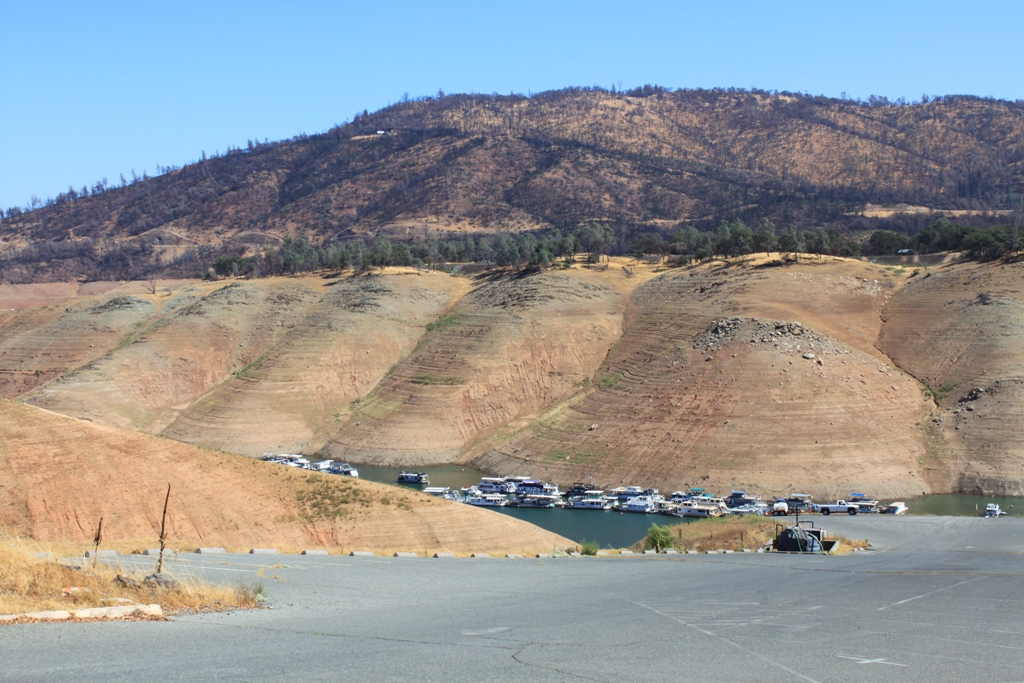
Water storage and hydrologic conditions across the State continued to decline over this past month. As of yesterday, total north CVP reservoir storage stood at 52% of the 15-year average. Total north CVP storage capacity was only 25.5%. In other words, our north CVP reservoirs are only one-quarter full.
Despite this, and surprisingly, only San Luis and Shasta reservoirs were below 50% of their 15-year averages (e.g., at 15 and 47%, respectively). New Melones, which has maintained uncharacteristically high storage levels throughout these recent years, finished the WY at 66% of its typical 15-year average. Total CVP/SWP reservoir storage was 7.435 MAF (or 48.2% of total reservoir storage capacity).
While the reservoir storage numbers look bad, context is important. Take Folsom Reservoir as an example. Current storage at this reservoir stands at 230 TAF or 23.5% of total reservoir capacity. This storage level represents 53% of the 15-year average of the reservoir’s storage for this time of year. Typically, Folsom Reservoir at this time of year holds about 430 TAF in storage, in other words, it is typically less than half full. Current conditions should emphasize, if nothing else, the precarious nature with which Folsom Reservoir must operate given its undersized capacity relative to the size of the draining American River watershed above it. Interestingly, releases from Folsom Dam were reported as 568 cfs yesterday, which is only slightly above the 500 cfs minimum prescribed by D-893 for the lower American River confluence with the Sacramento River after September 15th and notably below the LAR Flow Management Standard proposed minimum. It is not often that releases on this iconic northern California river ever approach those set out in D-893.
Last month we confirmed that despite very low cumulative precipitation levels across the State, conditions were not yet as dire as the driest year on record, Water Year 1977. Over the past 30-days, however, that has changed for some areas of the State. For example, while the American River at Blue Canyon has received almost 84% more precipitation than it did in 1977, Shasta Dam has received about 6% less than it did in 1977. This disparity only reinforces the notion of how spatially variable precipitation across California can be, even during drought conditions. Despite what many believe, precipitation shortfalls are not necessarily universally widespread. While cumulative precipitation levels have been low in some locations, the actual percentages in terms of annual averages are not as grim as some might want you to believe. From Trinity, through the central Sierras, south to Huntington Lake, accumulated precipitation values were below average; but not that far below average. For example, at Trinity, Shasta, Blue Canyon and New Melones, precipitation was 55, 40, 50, and 61% of average, respectively.
There is nothing on the immediate horizon for October, although the depending on which forecast one relies upon, the 2021-2022 WY can look quite different.
Prepared by Robert Shibatani
Robert Shibatani, a physical hydrologist with over 35-years combined experience as an international expert witness on reservoir-operations, climate change hydrology, commercial flood damage litigation, and water supply development. He is Managing Partner for The SHIBATANI GROUP International, a division of The SHIBATANI GROUP Inc. and resides in Sacramento, California. robert@theshibatanigroup.com
Current Reservoir and Water Conditions
Click on any graphic to enter the slideshow.
FOR MORE INFORMATION
Reservoirs
- Daily Reservoir Summary
- Selected Reservoirs, Daily Graphs (interactive)
- CA Data Exchange Center: Reservoirs
- CVP Daily Water Supply Report
Precipitation
- Real-time Rainfall Maps
- Detailed Monthly Precipitation Summary for Water Year
- Center for Western Weather and Water Extremes (CW3E)
Snow
Full Natural Flow Data
Drought/Climate
Water Project Operations
- State Water Project Operations and Delta Status
- Central Valley Project Operations
- Lower Colorado River Operations
Delta conditions
- Bay-Delta Live (Real Time Delta Conditions)
- EcoAtlas (Delta Restoration Projects)
Specialty Portals
- My Water Quality (CA Water Quality Monitoring Council)
- Fish Surveys (Department of Fish and Wildlife)
- NASA GRACE Groundwater and Soil Moisture Conditions


