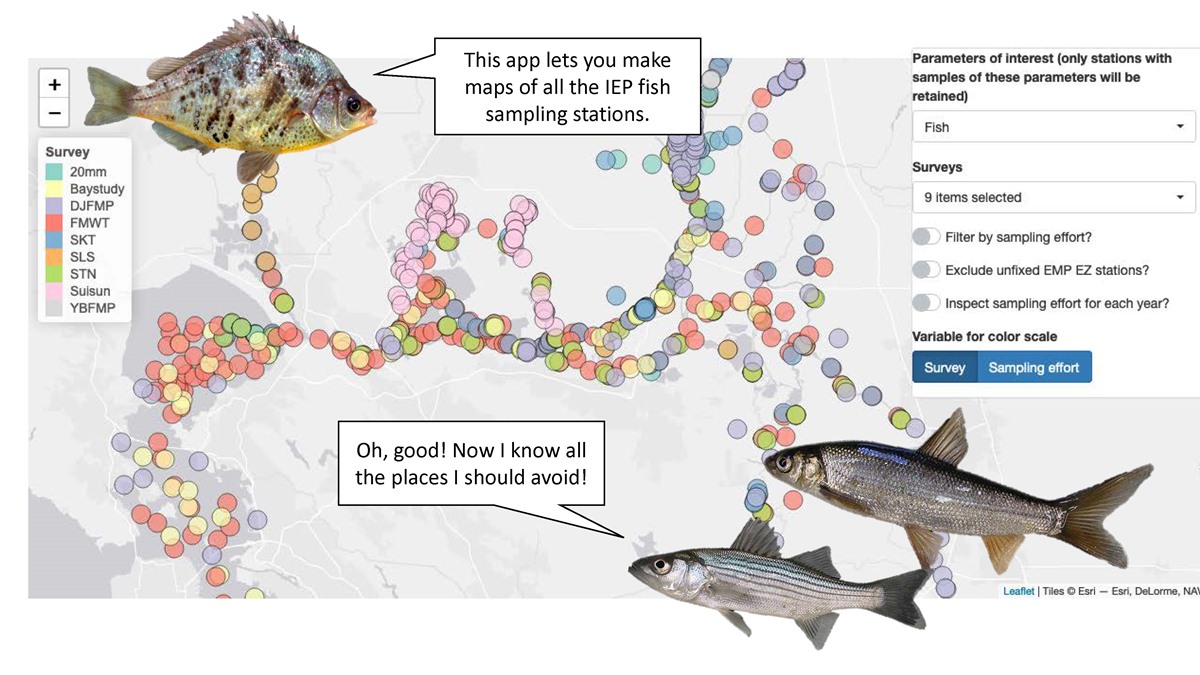
From the Interagency Ecological Program’s Science Stories: Adventures in Bay-Delta Data
“One of life’s greatest joys is playing with data. However, not everyone has the time or experience needed to make fancy graphs. Fortunately, availability of on-line web applications that allow people with no data analysis experience to visualize status and trends of data across space and time has exploded in recent years.
One of the first data visualization tools was the mapping widgets on the CDFW website. These maps allow you to plot the catch for different fish species as different size bubbles, and have been available since the late 1990s …
But we needed better ways to display data from multiple surveys at once at the click of a button …
Click here to read the full post at the IEP website.


