The 2014 California Water Policy Seminar Series presented by the UC Davis Center for Watershed Sciences and the law school’s California Environmental Law & Policy Center is focusing on how to manage water systems for both ecosystem and economic objectives – an immense challenge for engineers, ecologists, lawyers, water managers and policymakers alike. This year’s seminar series explores the “reconciliation” approach to saving nature, or in other words, changing human-dominated landscapes in ways that favor desirable species. An emerging discipline, reconciliation ecology is based on the premise that traditional conservation strategies of designating nature reserves and restoration projects will not afford enough protection to present large-scale extinction.
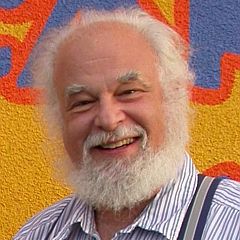 The series kicked off in January with the “father” of reconciliation ecology, Michael Rosenzweig,who first articulated the idea in the 2003 book “Win-Win Ecology: How the Earth’s Species Can Survive in the Midst of Human Enterprise”. He defines ‘reconciliation ecology’ as ‘the science of inventing, establishing and maintaining new habitats to conserve species diversity in places where people live, work and play.’ In his speech, “Tactics for conserving diversity: global vertebrate patterns point the way,” he gives the basis for his theory and provides some examples of where reconciliation ecology has been already successfully implemented.
Michael Rosenzweig began by saying that he looks at this as a very, very long-term problem, one that he clearly won’t be around to see come to a resolution. “We’re here today as beginners in a process which could take 1,000 years or 100 years, or 200 years. Whatever the number is, I don’t intend to live that long,” he said. “We are therefore looking through what I call the ‘ecologist’s telescope.’”
He said he would be sharing the results of last year’s research because he wanted to show what the future would look like under certain circumstances. “Now I’m doing this as a scientist. And as a scientist, I have no more votes than anybody else. I have to be very careful to keep my boosterism for diversity under control,” he said, emphasizing how important it is that policymakers and citizens be able to rely on scientists for unbiased neutral information. “We have to tell the truth, and the truth in many cases is we don’t know what’s going to happen.”
“I’ll show you some things that I think are true today, and they are based upon what has been called Ecology’s Fundamental Law,” he said. “It was discovered by Alexander von Humboldt in 1805, and it’s simply that size matters. The more area, the more species.”
He explained why he felt this to be true. The scale we are looking at is the ‘sustainable scale’, he said. “The self-sustainable scale of diversity is the scale at which we can say that this area generates the species and when it suffers an extinction, that extinction is global,” said Mr. Rosenzweig. “Self-contained means self-sustainable.”
“There’s a mathematical definition for that,” he said. “However, those regions don’t exist, so for the purposes of analysis, we’ll pretend that there are these self-sustainable regions in which the endemicity is 100%, every single species was born there, and when it becomes extinct, it will be gone from the surface of the Earth forever.” He acknowledged that this leaves out a lot of other scales in species-area relationships, but for the purposes of reconciliation ecology in order to preserve diversity, this is the scale that matters.
Island biogeography is a field that examines the factors that affect the biodiversity of isolated natural communities. Originally developed to explain species richness of actual islands, it is now used to reference any ecosystem that is surrounded by unlike ecosystems. “In all of island bio-geography theory, there is a big daddy – a donor. There’s a place from which the island gets its species, and when the island loses its species, it’s a local loss, because it can always, in time, replace that extinct species by getting it back from the donor all over again,” he said. “There are do-overs in island bio-geography that do not exist at the scale of the entire self-contained region that we will look at today.”
We need a model to describe the dynamic balance or the give-and-take that presents us with a self-sustaining region, he said. “In system analysis, if you want something to be in a dynamic steady state that is stable, you need to find a feedback variable – something that’s going to affect the rate of increase or decrease of the variable that you care about, which in this case is the number of species,” he said. “The only feedback variable that I can find is the area that a species occupies – its range.”
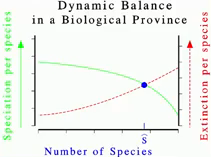 “As those areas get reduced in size, the chances for vicariance are reduced, the rate of speciation is reduced. The more species, the less area each one will have, and that’s the hypothesis here that drives the theory,” he said, presenting a chart illustrating the dynamic balance in a biological province. “The more species, the less area for species, the lower the rate of speciation per species, and you can see that as the number of species increases, that’s declining.”
Extinction for species is much like island biogeography, he said. “The greater the number of parts that the resources are divided into, the smaller the populations, and the smaller the populations, the higher the extinction rate for species,” he said. “This generates an internal steady state, and that steady state is stable. You can analyze it trivially, and it’s going to last according to this particular model. Fine. But what if we change the area? How does that affect things?”
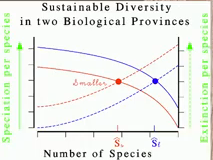 “The answer is if we change the area, we can make the prediction that von Humboldt’s rule follows whole zoological regions at the scale of the entire globe,” said Mr. Rosenzweig. He presented a diagram, titled Sustainable Diversity in two Biological Provinces, and noted that red line represents a smaller area and the blue line represents a larger area. “We can expect that for any given number of species, the average range size will be higher where there’s more land, and so the curve of the speciation rate per species will be elevated and the extinction curve will be depressed because there are greater populations for any fixed number of species,” he said.
Now you can’t just go out into a place, measure the extinction rate at any given instant and make any conclusions whatsoever, he pointed out. “This is a theory about rate curves, not data points but curves, and as long as you understand that, it’s easy to do … In general, the larger the area and the greater the number of species at the steady state,” he said, noting that we do see progressions like that in literature, the fossil records, and even with trees in the northern hemisphere going back a couple of hundred million years. “Ocean goes up, land shrinks in effect. Ocean level goes down, land expands in effect. And keeping time to the music is the species diversity of the fossil trees. It’s remarkable. It’s a thing which is however, repeated many, many times.”
He needed a database to test the theory, and the World Wildlife Fund has a large database that covers 800 ecoregions of the world, he said, explaining that the ecoregions divide up the world into different biological places of different sizes, which help to make biological sense of the geography, and are more useful in this endeavor than the political lines that are drawn on the map.
The World Wildlife Fund database looks at every single species of bird, mammal, reptile, and amphibian on the terrestrial surface of the globe, along with the records and 102 climactic variables, he said, but we’re going to need to filter it in a couple of ways.
“First, sometimes, a species will live in two different zoological regions because they haven’t read math books,” he said. “So if I wanted to tell you how many species there were, I can’t simply add up the number of species in the World Wildlife lists. When we do our filtering, we find out we were working with 24,992 vertebrate species, and that’s not all that seemed to be there, but that’s all that we really need.”
In addition to that, there were 4,416 unique genera in the data set that we used, he said. “That’s plenty, but those do not include certain things which are bad ways to test this theory about the relationship between area and global diversity,” said Mr. Rosenzweig, noting for example, islands were thrown out because when an island or archipelago was generating new species, they didn’t know what the signal was. “Should we treat it as though its own zoological region, or is it part zoological region and part island? With so many different species, in so many different places, 755 eco-regions to be exact, we just kicked it out… Bad data, not good for the test.”
 We also needed to know to which eco-region the species belonged, he said. “The World Wildlife Fund gives you a suggestion, but the suggestion is only approximately good,” he said. We tried filtering by looking at endemicity, so we tried eco-regions of different sizes, draw the borders differently, and had a back and forth between the data set, finally ending up with nine separate, self-contained, self-sustaining zoological regions, he explained. They are very similar to Sclater’s original declaration of the principle of zoo-geographical regions, but not absolutely; there are some differences, he acknowledged.
 “In the end, the endemicity looks like this,” he said, presenting a slide of the results at the species level, noting that Madagascar is 83% endemic species while the Paleo-Arctic is only 37% endemic species. He noted that the reason for the low values is in part because birds were difficult to decide, as birds migrate and it’s difficult to decide where they belong or where they’ve actually originated, he explained.
“We decided then that we were going to analyze these things and see whether there was a relationship between the area of the zoo-geographical region and the number of species that it held,” he said, noting that climate matters, too. “You can’t ignore the fact that the signal of climate is in the results of diversity at these levels.”
 “Here are the results for the first test which calculates the variables from the World Wildlife Fund,” he said, presenting a slide of mathematical formulas titled Calculated Variables of the Analyses. “It looks formidable, but it’s not. We just sum the areas of all the eco-regions in a particular zoo-geographical region and call that the area of the region. To calculate mean temperature, we take the weighted average of the temperature of each of the regions, multiply the temperature of a region by its area, divide by the total area so we have a proportional effect, and then sum the result and that give us one number for the entire zoo-geographical region,” he said, noting it was ‘ridiculous’ to assign one temperature to an entire region, but he didn’t know what else to do.
Evapotranspiration was calculated much the same way, he said, noting that evapotranspiration has been found to be a good surrogate for productivity. “We’re using the weighted average,” he said. “So we take the actual evapotranspiration of a particular eco-region multiplied by the area of the eco-region and divide by the whole to get the weighted fraction, and we get one actual evapo-transpiration for each of the nine zoo-geographical regions,” he said. “Also ridiculous, but it’s there. Well it turns out it works.”
 He then presented a slide titled Area and Climate Set Global Diversity, which plotted the evapotranspiration variables against the hypothesized results to determine their correlation, resulting in a statistical calculation known as the ‘coefficient of determination’, also referred to as ‘R-squared’.
“We got an R squared of 97% with that set of variables,” he said. “When I saw that graph, I could not believe it.” These are very significant numbers, even with only nine points, one number for temperature, and one number for actual evapotranspiration, he said. “The largest error is Australasia – Australia and New Guinea, actually. It’s about a half order of magnitude when you plot it this way, so Australia has about twice as many species of vertebrates as it ought to. If you think about the biology of Australia and what we’ve learned there, you’d say, ‘If Australia isn’t odd, there’s something wrong with this study ’cause everybody knows Australia has too many vertebrates.’ So our error in a sense, becomes a confirmation of the work of the World Wildlife Foundation in putting all these things together.”
It’s crazy but it works, he said, even with different classes of vertebrates, showing a series of charts depicting the graphs for amphibians, birds, mammals and reptiles. “You can separate this out into birds, mammals, etcetera, and it works for all four classes, pretty much the same way. There’s a reduction in significance a little bit, but not much. And considering the fact that there are far fewer species that have been analyzed here, you’d expect a reduction of significance.”
“What about the climate variable?” he said. “If actual evapotranspiration is the stand-in for productivity, what is temperature the stand-in for? How does that work to promote speciation rates or reduce extinction rates? That’s a puzzle that has daunted me for a long time … I think this is the biggest puzzle in all of diversity science. How does climate do its work? How does it influence speciation rate curves and extinction rate curves to bring about this kind of magnificent correlation?”
 We are losing area to nature, he said, and with this data, we can now predict through the telescope what this is going to cost the world of vertebrates in the long run. “The answer is a lot,” he said. “This scenario assumes that we somehow managed to take only 60% of the area of the terrestrial surface of the earth away from nature. If we take a certain proportion of the energy using the actual evapotranspiration to calculate it, we leave 60% of the AE, so we have 60% and 60% remaining, the result is an extinction that has been called a mass extinction by every paleobiologists that has ever looked at the rates of mass extinction. We have, at this point, left only about 35% of the vertebrate species of the earth, and that’s a rosy future.”
“If, in fact, you think, ‘Well, we’re really at 5% or 10% of the area’, then, looking at extinctions of 90% and 96% of the vertebrate species, it’s an unprecedented mass extinction that we are causing according to this result,” he said. If one considers that it’s temperature and not energy flow that’s producing this result, the graph does show that temperature ameliorates things a little bit, he said. “So if you’ve got 20% of the area left, then you’re going to find that you have approximately 70% extinction instead of 80% or 85% extinction.”
“Are we doomed? This vertebrate life on the surface of the earth doomed? It’s going to be a world of bacteria? Already is, according to a lot of people,” he said.
 Mr. Rosenzweig then said he looked to see if the same principles would apply to genera – the biological classification of organisms. “Yes, area plays its role and we have a mechanism for that, but I don’t have any mechanisms for genera,” he said. He then presented a graph that depicted generic diversity as a function of actual evapotranspiration, noting that the R squared is 97.2%. “Pretty impressive,” he pointed out.
 He next presented a graph depicting generic diversity as a function of temperature, and noted, “It’s also pretty impressive – it’s 96.4% for the R squared, so the number of genera appears to follow the same pattern as the number of species.”
 Let’s take a closer look and see if we’re being fooled by these graphs, Mr. Rosenzweig said. “The answer is we’re not. The number of genera does follow the number of species,” he said, presenting a graph of the same data, now depicting genera as a function of the number of species in the zoogeographical region. “The R squared here is 0.999 something, I can’t remember,” he said. “It’s remarkable how good this relationship is, and if you think about it, a couple of things become apparent. One of them is that it has a slope which is well below 1, which means that as you add species, you’re adding species a whole lot faster than you’re adding genera, and we’ve known that for a long time. Empirically, it’s true that if you go to a place which is diverse at the specific level, then it’s not quite as diverse at the generic level on a per-species basis. There are more species packed into each genus which suggests that we’re going to lose genera when we lose species, and we’re going to lose a lot of them.”
So what about higher taxonomic categories? “It works for them too, unfortunately,” he said. “There isn’t going to be a magic retention of generic diversity when we suffer mass extinction of the species.”
 He then presented a slide of calculations utilizing the coefficients titled Global Loss of Vertebrate Diversity, and explained that the calculation had to be done in two stages. “The first stage is the stage of exotic species. We bring an exotic species, we break down the barriers between these zoo-geographical regions and we bring on the homogocene,” he said, referring to a term coined by ecologist Gordon Orians to describe the current period of global history in which widespread and rapid mixing of species is occurring at unprecedented rates.
“It’s taxon-specific, it depends upon the particular relationship between the large classes and area and that’s very different. Birds have what we would call a Z value in species area terms that is much lower than mammals,” he said. “So for mammals, loss of independence doesn’t mean anything, and that was a good calculation for them.”
However, it is not the same for other vertebrates, he said. “For amphibians, it is also unimportant how many zoo-geographical regions there are,” he said. “There’s a loss, yes, but it’s not terrible. But for birds and reptiles, it’s a disaster, and so for technical and mathematical reasons, we have to calculate that first.” Referring back to the chart, he said, “We start with 24,992 species. The new Pangaea will house 13,309 at its new steady state, which is a loss of 47% of the species. If that isn’t a mass extinction, I don’t know what it is.”
He pointed out that the number of genera is reduced from 4,416 to 2,239 which means and even higher proportion of genera will be lost. “49% will be gone; not good,” he said.
The second step is to take that data and generate area loss, he said. “We’re still going to have 13,309 species and 2,239 genera,” he said. “But lose 50% of the area of the regions, and we drop to 8,593. Lose 80%, we drop to 4,820. Lose 95% and we drop to 2,010. We started at 24,992, and we wind up here in terms of the number species at 2010. That’s over 90% extinction rate for species. And the number of genera shows us the same pattern.”
“If you look at the combination, the species loss with a 50% loss of area will cost you 66% of the species, and 92% of them if you lose 95% of the area,” he pointed out. “Genera losses are 88%. If you lose only half of the area, then it’s still 64%. There’s no case where there isn’t a mass extinction here.”
“If we don’t stop taking area away from nature, if we don’t begin to pay attention to the fact that we do not have to take area away from nature in order to do our business, to live our lives, to make our profits, if we don’t start to realize that there’s another way to put our foot on the ground, then those are the proportions of species in genera amongst the vertebrates that we’re going to lose,” he said.
 So what can we do about this? “The traditional thing that we do about it is to try to reserve habitats, or even with restoration ecology, to try to restore patches of nature that we’ve abused,” he said. “I don’t think that should be abandoned and it can’t be abandoned if we want success. But it’s not enough, and here’s why it’s not enough. This cartoon has actually captured exactly what’s going on. There are species trying to survive in the small patches that we’ve preserved for them and they’re not too happy about it. And we’ve seen from the math, that they shouldn’t be too happy about it. We’ve seen from the data of the World Wildlife Fund that they shouldn’t be too happy about it.”
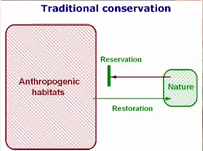 There are two distinct threats when habitat is removed, he said. “One of them is answered by the reservation ecology approach and that is to make sure no habitat disappears altogether. That attitude has saved a tremendous number of species to date by slowing extinction rates down, but it hasn’t touched the quantitative problem. The quantitative problem is size matters. And even if you have all the habitats represented in some remnant patches, you are going to lose species because the dynamics will be eroded.”
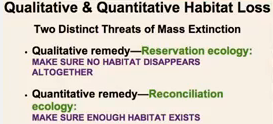 The solution is reconciliation ecology, he said. “Stop thinking that you can’t do any good in places that you use or in places that you live. Stop thinking that in order to make a profit, you have to destroy. Stop thinking that in order to make a pretty neighborhood, you have to bring in all kinds of exotic species and plant them in your front yard,” he said. “Start changing your attitude, start thinking about co-existing with nature, but in a proactive sort of way; think of redesigning the world that we use so that we reconcile it. We can live there and they can live there. We can make a profit and they can make a profit. We can enjoy it and they can enjoy it. And the political nonsense that pits the green world against the green world of money disappears. It’s a false dichotomy, it disappears.”
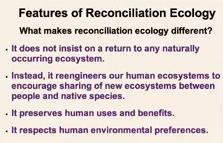 So what are the features of reconciliation ecology that we ought to be cognizant of? “First, it doesn’t insist on the return to any natural occurring ecosystem,” he said. “It works with what we have available to us … it doesn’t start looking for the way the world was when Columbus landed in the West Indies. Second, it re-engineers our ecosystems so that we’re encouraging sharing of those ecosystems between people and native species. Third, it preserves human uses and benefits. Fourth, it respects human environmental preferences that is absolutely crucial and it works locally. It’s like a new natural history, taking account of local conditions and local needs.”
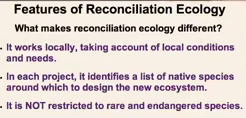 To be a successful reconciliation ecologist, you have to get your hands dirty, he said. “You start with some local area, you find out what the needs of the species are there, and then you build the new ecosystem on the basis of what you find locally,” he said. “You have a global impact and a global vision, but your work has to be local.”
And finally, reconciliation ecology is not restricted only to rare and endangered species. “Look at the extinctions that have happened to some of the most incredibly abundant vertebrate species in this continent and others,” he said. “Look at the passenger pigeon which was at one time, THE single most populous bird in the world – four billion passenger pigeons, and they’re gone. They’re gone. Example after example shows us that high density of population or high amount of population does not protect a species.”
 “From my perspective, we are looking at a system property of a very complex system and every single species is endangered,” he said, pointing out that just because a law has not determined a species as endangered does not mean that the law is right. “Nature is right and nature tells us, ‘Don’t ignore common species.’”
The Yolo Basin is a good example of this, he said. “It’s working. What’s happening, too, is the projects are showing how you can do this kind of work in rice paddies around here, so that the farmer is growing rice very productively, and also fish very productively.”

Mr. Rosenzweig is the director of the Tumamoc project in Tucson that is trying to spread the populations of native plants throughout the city by getting people i
nvolved and getting neighborhoods involved, he said. Tumamoc Hill, the site of the world’s oldest permanent ecology study plots, has been studying botanical life histories and populations of the Tucson area since 1905. “We have the data and we have the species,” he said. “There are over 300 species and we have a set of people or growers who are rearing to go. These people have already figured out how to germinate and sell at a profit 81 of our 300+ species.”
The project depends on unpaid volunteers who are trained as well as a group of robust NGOs. “I love all of them. They are great, great people, and they’re committed to ecological preservation, and they’re working very beautifully in the community already. It also has local governments that really care about the environment. … We have people in the government who care about conservation and who are aware of the tremendous number of species that live in our valley, and are committed to making sure that we do the very best to preserve them.”
“I want to finish up with the best example of reconciliation ecology that I know, said Mr. Rosenzweig. “It’s mature, it’s been around for 20 years, and it’s an extraordinarily huge target, and it’s a farm too. Farms are really, really, really important because they cover so much of the area of the earth.”
 In southeastern Minnesota, farmers have been growing soy to feed cattle, he said. “That’s what soy is for, and they’ve been doing immense amounts of ecological harm. Every year their farms look like that,” he said, presenting a picture of a barren, plowed field. “There is no carbon storage. There is the potential for run-off of pesticides and fertilizer. There is the potential for soil loss. All of those potentials are realized. There is also a tremendous loss to the atmosphere of nitrous oxide, which is a much more powerful pollutant in global warming than carbon dioxide itself, and most of it comes from farms like this.”
The idea at Badgersett Farms, a research farm operating in southeastern Minnesota, was to use woody agriculture to store carbon dioxide. With research and truly creative and clever selection experiments, they have been able to produce a brand new species of hazelnut that grows on shrubs, he said. “They can be selected to have just the right size to be mechanically picked or shaken. They can be selected to mature as quickly as a year and a half of age, they can be selected to do almost everything you like except to jump through a fiery hoop – they haven’t figured that one out,” he joked.
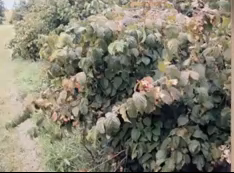 This is a new species of hazel bred from two native species – not genetic modification just plain interbreeding followed by selection, he said, noting that the yields are immense and they have figured out how to turn the dry kernels into BTUs. “It’s remarkable. You get from this about four times as much as you would get from the equivalent amounts of land planted in soy.”
Mr. Rosenzweig then briefly described the techniques that Phil Rutter, the owner of Badgersett Research Farm, used to achieve his quick results. “He has a swarm of species in a genus, and they have various categories that he likes. Instead of working on each of them as individuals, which lowers the genetic variants through time, he brings them altogether and interbreeds a swarm of them. That increases immensely the genetic variants of fitness, and as we learned from Fisher 80 years ago, up goes the ability to move quickly in natural selection. And that’s what he does, and I’ve just seen some unbelievable quick things,” he said.
 In addition, these plantations do not use pesticides because experiments have shown that the pesticides don’t do anything except cost money, he said. “They do not release fertilizers so there’s no nitrous oxide and there’s no loss of fertilizer into the water of the streams around there. Why? Because they stay alive. They are not annual plants, they are alive all the time, and you can show that they taking every molecule of fertilizing. For the same reason, there’s no soil loss associated with them. …There’s no water pollution. They do not reduce the food supply, they increase the productivity by three or four-fold. … The oil that they produce not only can be fed to pigs, but you can burn it in your tractor. It’s ready for diesel. And of course, they store carbon dioxide in their perennial tissues. It’s a good deal.”
 It also turns out that although it was not intended, what Phil Rudder has done is to produce a new ecosystem that’s a veritable zoo, with species present that have not been seen commonly for many, many, many years, such as the colorful Saturniid Moth and the jumping spider, as well as tree frogs. “The place is full of these Tree Frogs, as well as other kinds of vertebrates,” he said.
 This is a successful project that is spreading, he said, presenting a map showing where hazel is being grown elsewhere in the United States. “In Nebraska, Wisconsin, Minnesota, and Iowa it’s a roaring success already,” he said. “Soy is about 50% of the agricultural landscape of the upper Midwest. … We’re talking about a major revolution that will produce habitat for wild things, profits for farmers, and ecological sanity for the country. That’s where I think we’re going, and that’s where I hope you go, too.”
“The general strategy is pretty clear. Conservation in our time has to learn how to make the future feel a lot like the past,” he concluded.
For more information …
- Click here to watch Michael Rosenzweig’s presentation on YouTube.
- Click here for more information on the 2014 California Water Policy Seminar Series.
- Click here for Michael Rosenzweig’s book, Win-Win Ecology: How the Earth’s Species Can Survive in the Midst of Human Enterprise (Amazon)
- Click here for more information on the Tumamoc Project.
- Click here for more on Badgersett Farms.
See also …
- Must Biodiversity Hot-Spots Be Social Not-Spots? Win-Win Ecology as Sustainable Social Policy, article in Consilience: The Journal of Sustainable Development
- The PPIC Plan: Making the Delta a place where the wild things want to be, a summary of the PPIC Report, Where the Wild Things Aren’t: Making the Delta a Better Place for Native Species, which advocates a reconciliation ecology approach to the Delta
- Where the Wild Things Aren’t: Making the Delta a Better Place for Native Species, the full report from PPIC

